Historical report: These figures describe trading on November 19, 2026. The original report was published on November 20 at 03:08 (UTC+8).
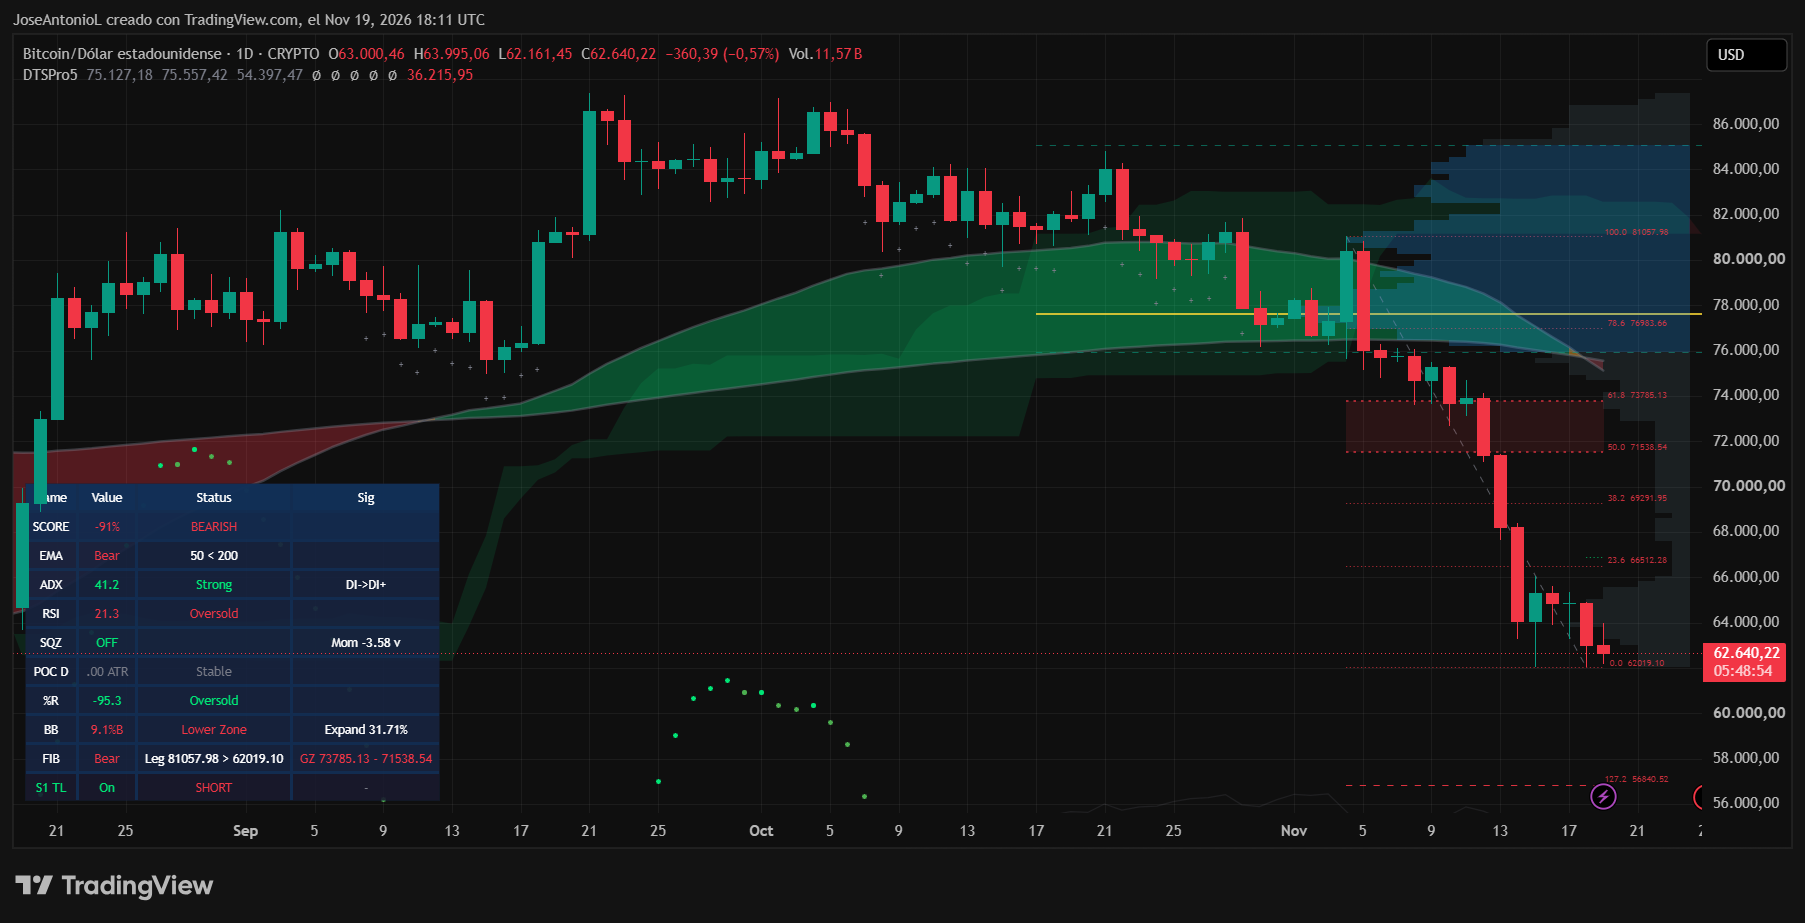
Bitcoin traded near $62,640 on November 19, down 0.6% for the day and roughly 28% below its late-September peak near $87,000. Its daily chart showed an EMA-based “death cross”: the 50-day exponential moving average was below the 200-day average, and Bitcoin traded below both.
What does that signal mean?
The alignment points to weaker recent prices relative to the longer-term trend. It is not the traditional death cross, which uses simple moving averages; exponential moving averages give more weight to recent prices and respond faster. The report said the crossover was confirmed that day, but a crossover cannot establish what Bitcoin will do next.
Other indicators also described a weak market. Bitcoin’s relative strength index (RSI) stood at 21.3, below the 30 level traders often call oversold. That can precede a bounce, but prices can continue to fall. The average directional index (ADX) was 41.2, above the 25 level commonly associated with a strong trend. ADX measures strength, not direction; in this case, the negative directional indicator was higher than the positive one.
What was happening beyond Bitcoin?
The weakness preceded Anthropic’s Nasdaq debut. Decrypt reported that Anthropic priced 980 million shares at $83, raising $81.34 billion, and that its shares opened at $111.50 under the ticker ANT. Despite that opening, broader markets were lower by 12:18 p.m. ET: the Nasdaq Composite was down 1.55%, the S&P 500 1.59%, and the Dow 2.03%.
The report also put U.S. spot Bitcoin ETF outflows at roughly $2.9 billion for the month, including $306.4 million the previous day, amid rising Treasury yields and expectations of further Federal Reserve rate hikes. Some traders argued that the IPO had drawn capital away from crypto, but the report said that explanation was unproven. Bitcoin and AI stocks had both declined, consistent with a broader retreat from risk.
The chart marked $62,019 as nearby support and $66,512 as the first level a recovery would need to reclaim. Those levels were observations from the November 19 chart, not durable price floors or forecasts. The indicators described momentum at that point in time; they did not explain its cause or predict a reversal.