Bitcoin fell below $60,000 on Friday, November 20, 2026, according to reporting published early the next day in UTC+8. It traded at $59,703.72 on the daily chart, down 3.55% for the session, after touching $59,300.13.
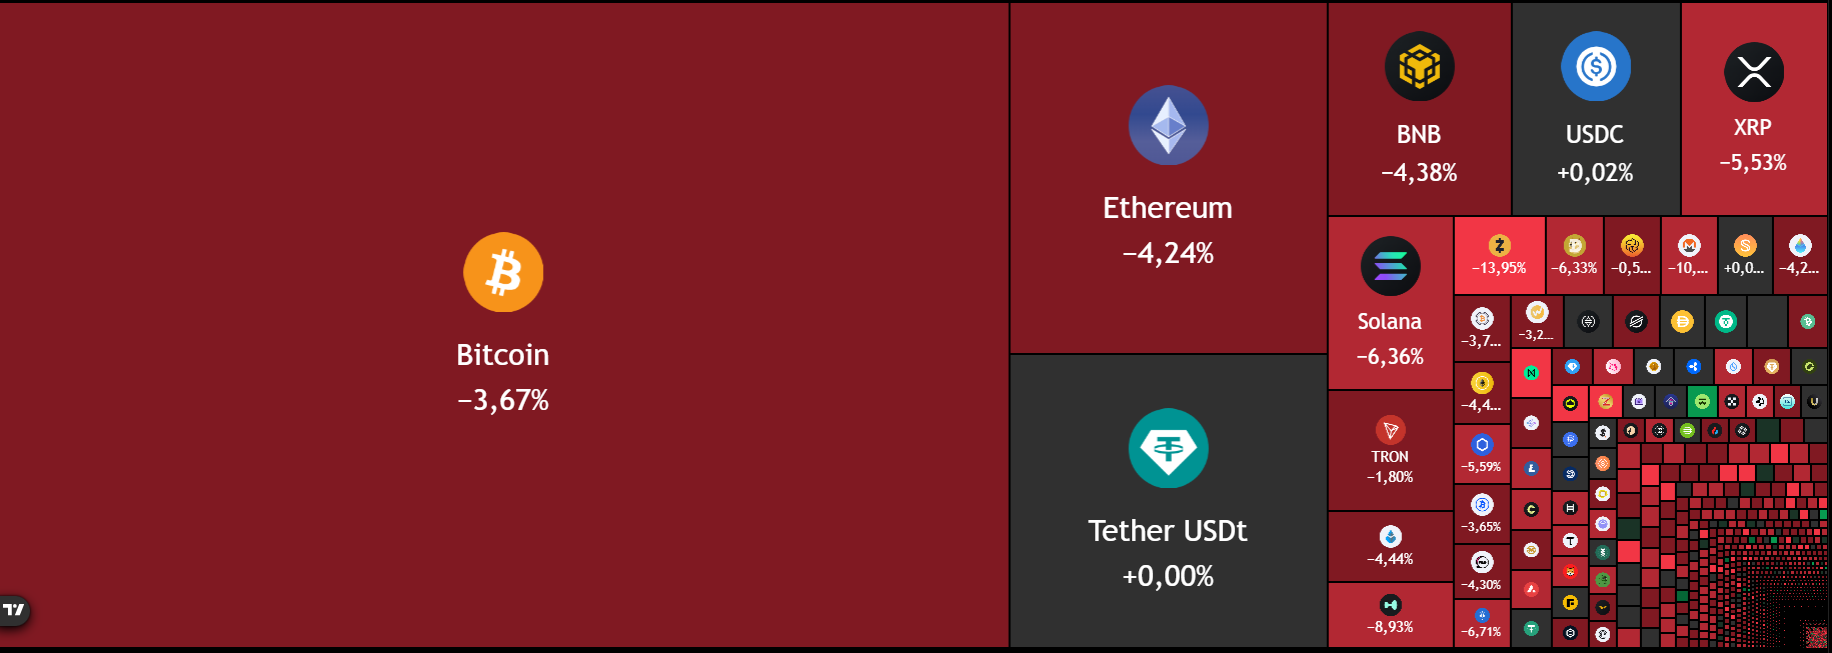
What was adding to the selloff? Decrypt reported that roughly $727 million in leveraged crypto positions had been liquidated over 24 hours, about 86% of them bullish bets. U.S. spot Bitcoin ETFs recorded $582.2 million in outflows on Thursday. Those withdrawals were part of roughly $2.9 billion in November outflows through Thursday, so they had begun before that week’s stock-market developments.

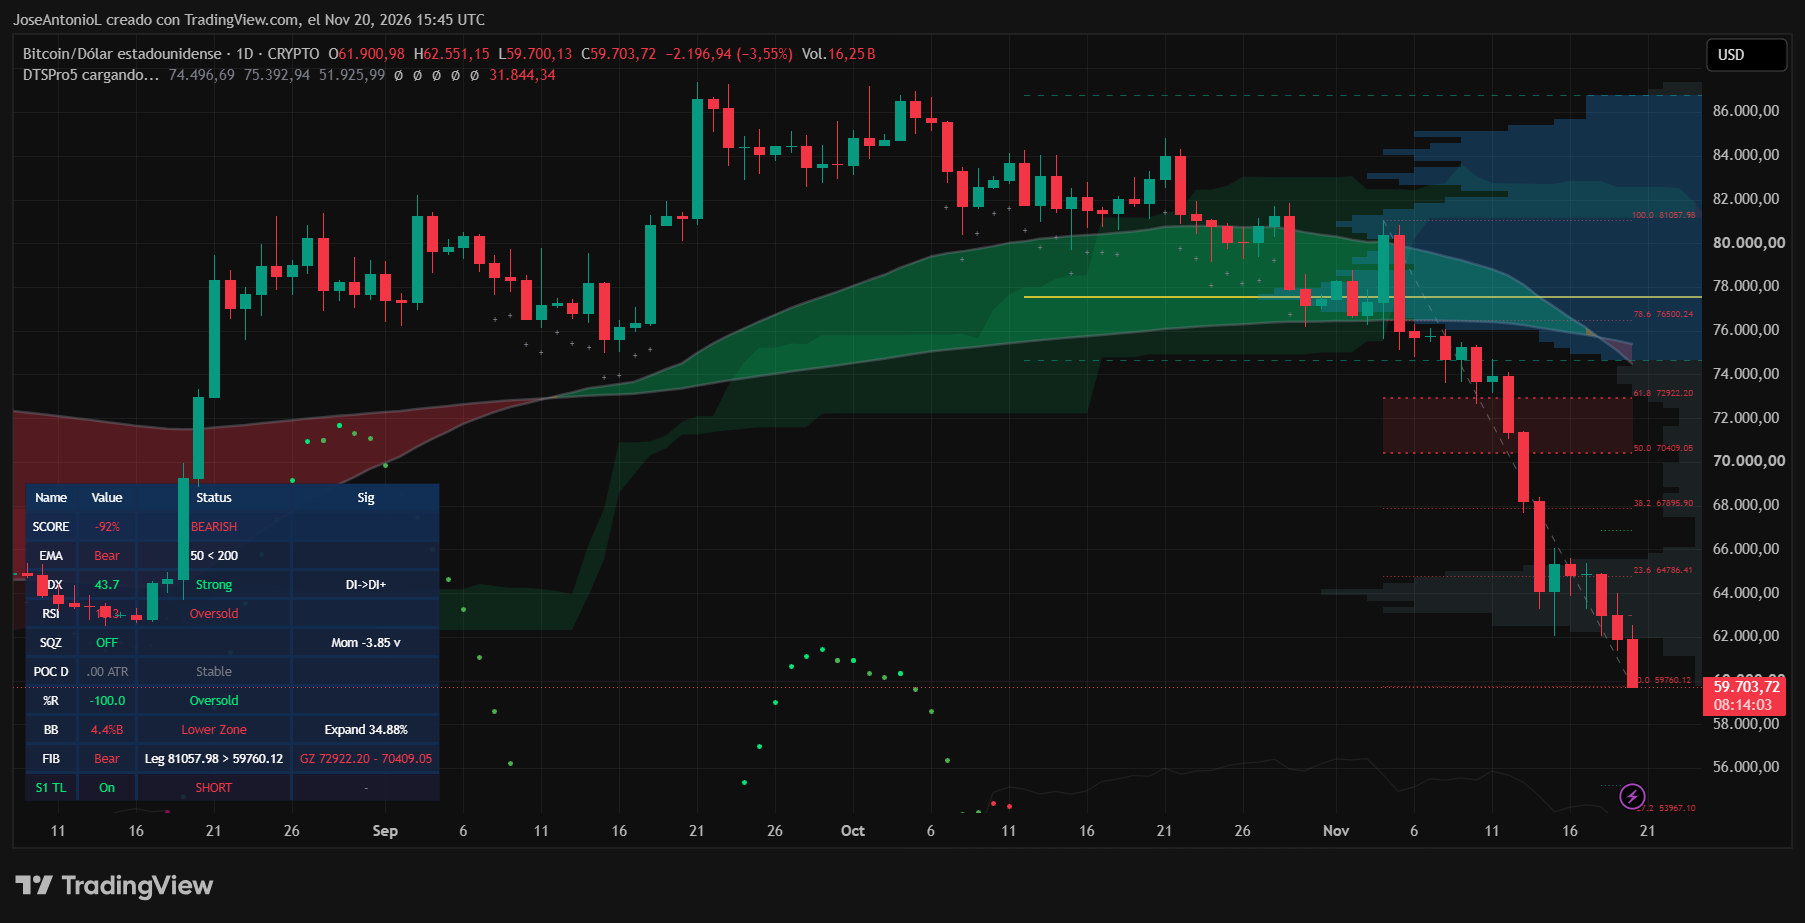
A crypto Fear and Greed Index reading of 9 signaled “extreme fear,” down from 18 a week earlier and 51 a month earlier. The index uses market data to gauge sentiment; it does not survey individual investors. Its 2026 low at that point was 5, recorded on February 5.
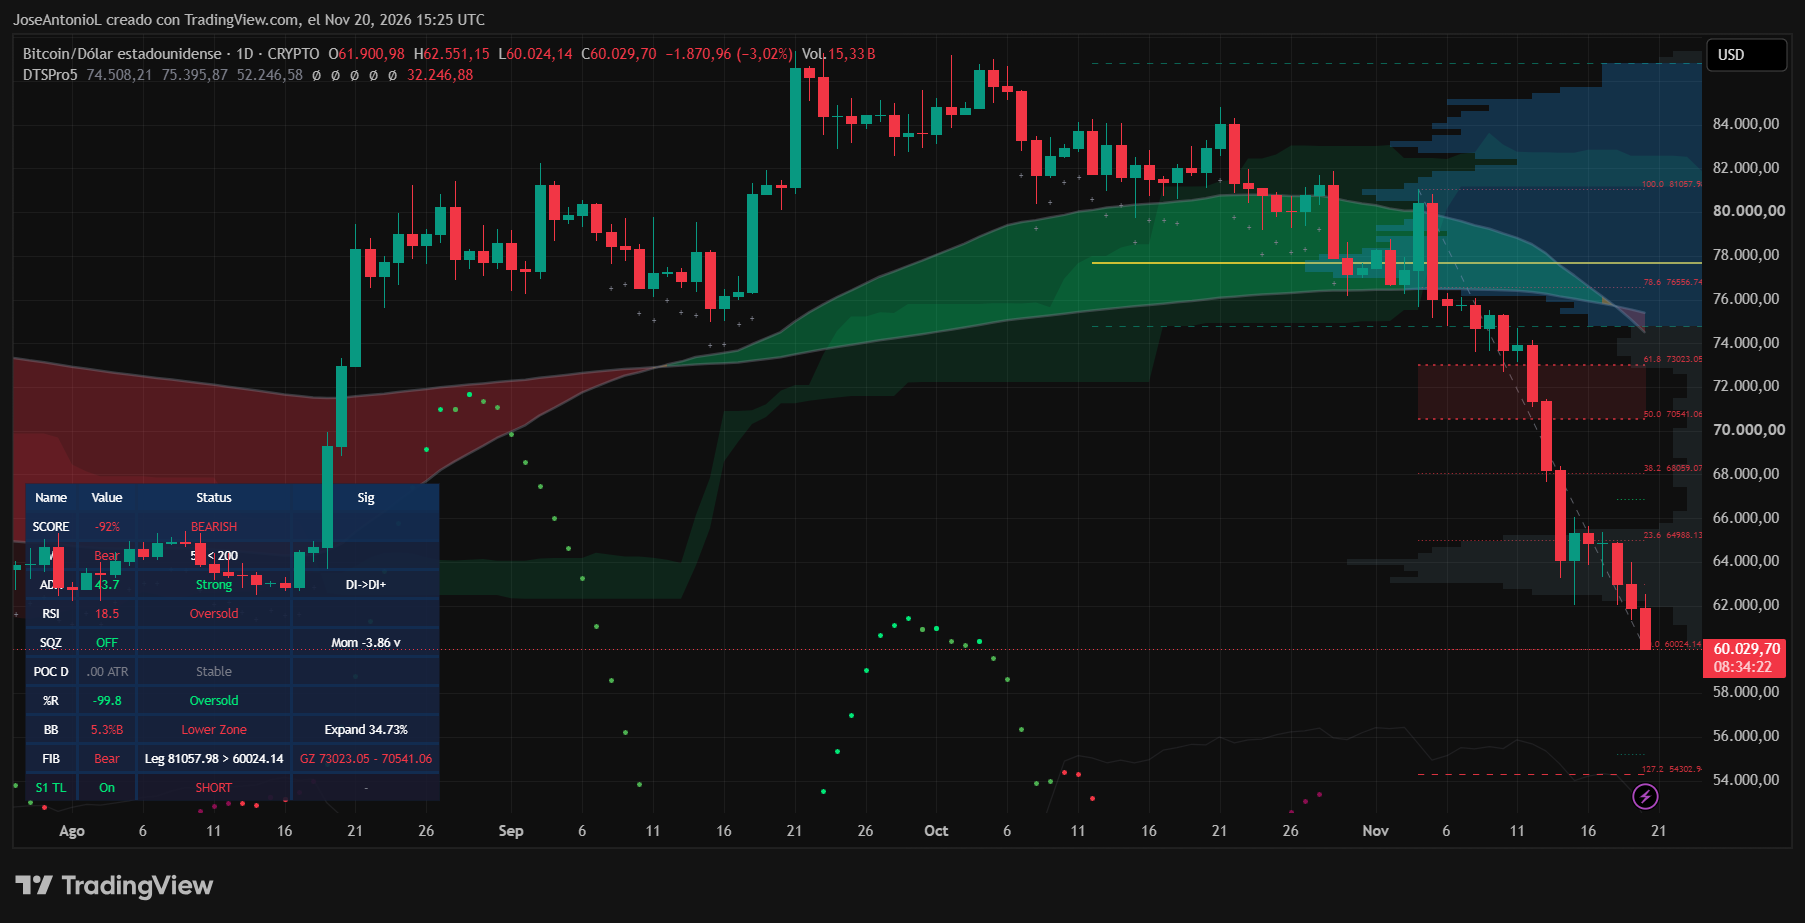
The reported chart also showed Bitcoin trading below its 50-day and 200-day exponential moving averages, with the shorter average below the longer one. Its relative strength index was in the teens—below the level commonly described as oversold. These measures describe the market at the time; neither extreme fear nor an oversold reading establishes when selling will end. The article identified $58,000–$59,000 as a nearby historical price area, not a guaranteed floor.