As reported on November 17, 2026, at 05:46 UTC+8, Bitcoin had fallen to around $62,100 on Sunday—its lowest level since July 14—before recovering to about $64,300 early Monday. The decline extended six consecutive weeks of losses. Why did it leave traders watching $60,000?
Forced selling added pressure
Roughly $2 billion in crypto derivatives positions were forcibly closed during the weekend slide, mostly bets on rising prices. CoinGlass figures showed $1.9 billion liquidated in one 24-hour period on Saturday, including about $1.8 billion in bullish positions across cryptocurrencies, not Bitcoin alone. A liquidation occurs when an exchange closes a borrowed position because the money backing it can no longer cover its losses.
U.S. spot Bitcoin ETFs had also seen withdrawals before the weekend. Decrypt’s ETF tracker recorded $185.4 million in net outflows on Friday, the seventh consecutive trading session of outflows. Withdrawals since November 5 totaled approximately $1.91 billion. Friday’s figure included $143.5 million from BlackRock’s IBIT and $41.9 million from Fidelity’s FBTC. These fund-flow figures measure creations and redemptions, not every investor trade; because the ETFs do not trade over the weekend, they do not show shareholders redeeming during Sunday’s drop.
Why $60,000 mattered
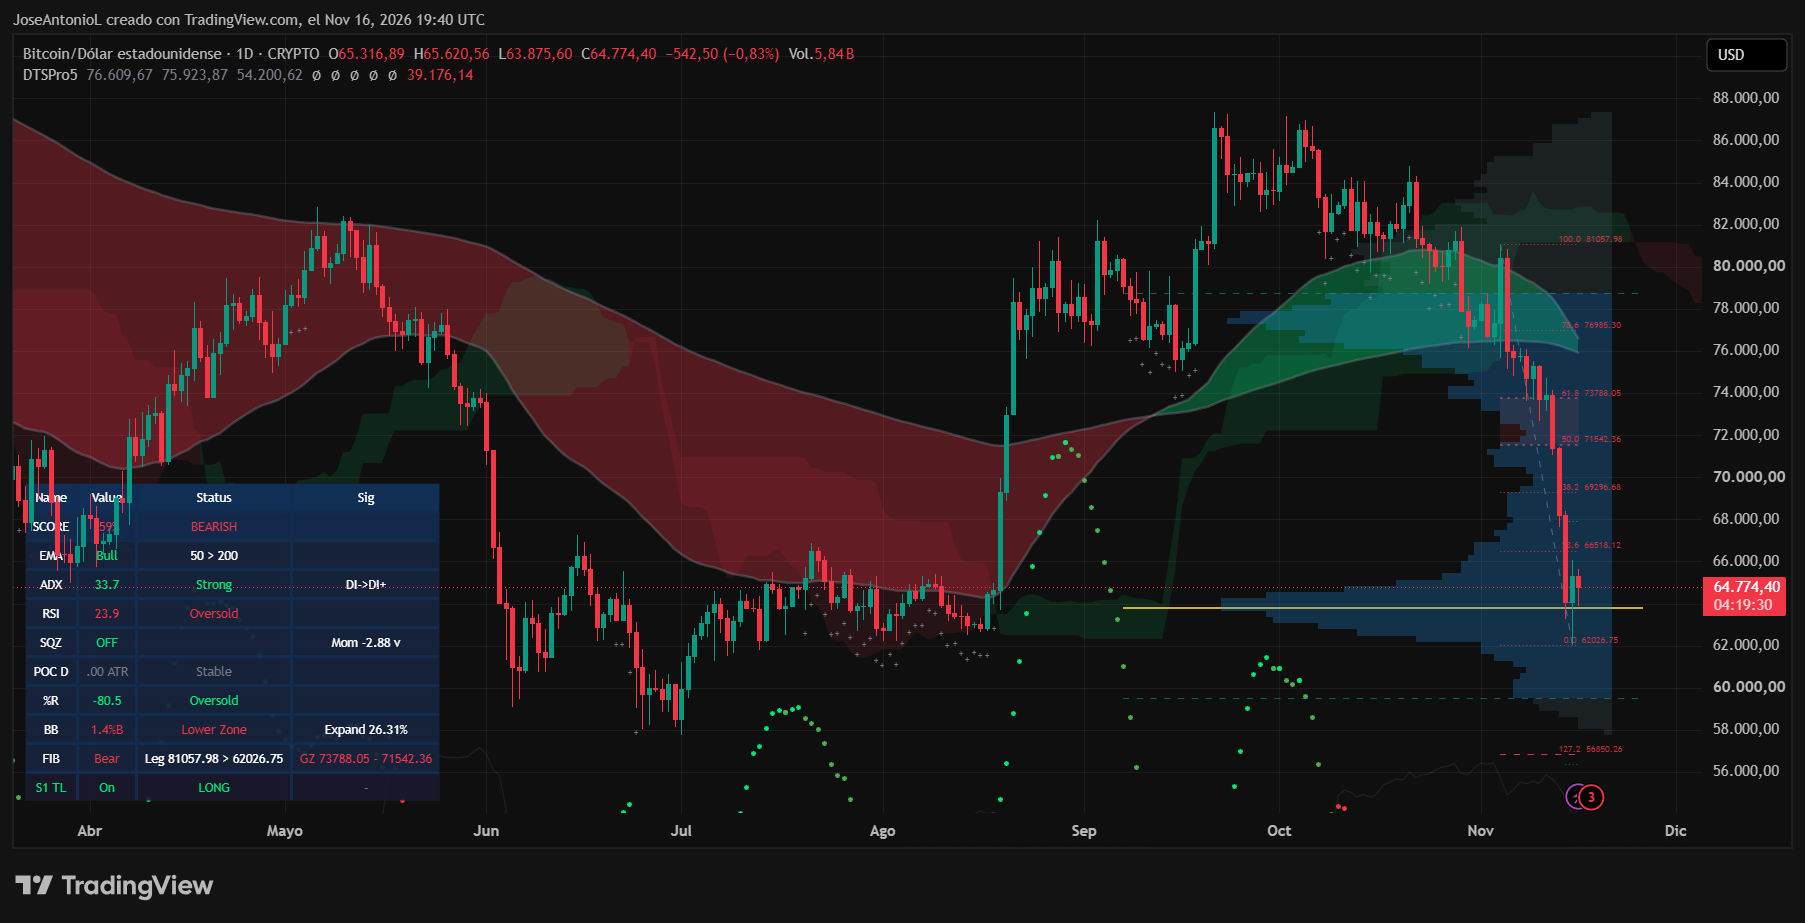
Bitcoin rebounded after approaching $62,000. A decisive move below that level would bring $60,000 into focus, where options traders had accumulated significant downside exposure. Contracts attracting recent activity included $50,000 puts ahead of the November 27 options expiration.
Chart readings offered no clear all-clear signal. The daily Relative Strength Index was near 24, indicating oversold conditions, while an Average Directional Index above 33 pointed to a strong prevailing trend with bearish pressure still dominant. The weekly RSI, near 38, was weak but not oversold. Potential resistance lay around $66,500–$67,200 and then $69,300, based on Fibonacci chart levels. These indicators describe recent trading; they cannot establish whether the rebound will hold.