As reported on November 18, 2026, bitcoin had fallen 14% over the preceding week after six straight weekly losses. Research firm K33 saw signs of a possible local bottom, but its evidence did not establish that the decline was over.
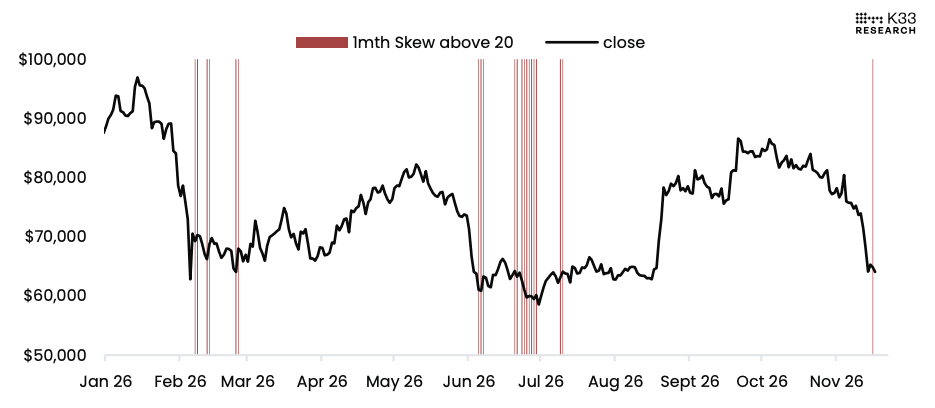
K33’s head of research, Vetle Lunde, said 51.5% of circulating bitcoin was held at a loss. Bitcoin had also fallen below its 200-week moving average; at one point, it traded about 8.5% beneath that measure, compared with 7.3% at its June low near $58,500. In the options market, demand for downside protection had pushed the one-month 25-delta skew above 20 for the first time since July. Lunde said similar readings had historically appeared near local bottoms, though past recoveries could involve prolonged consolidation rather than an immediate rebound.
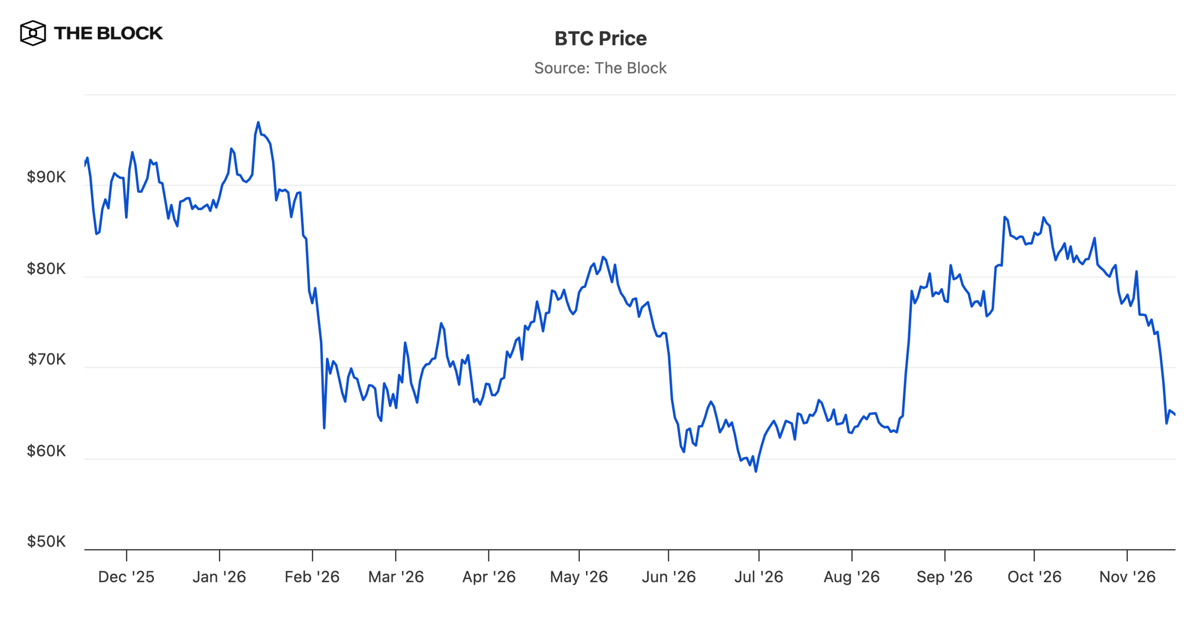
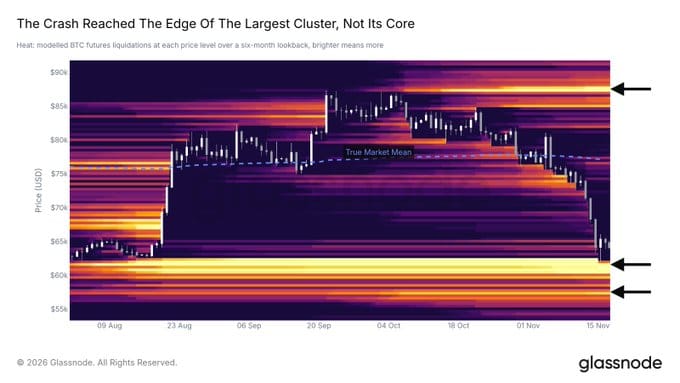
The price levels still mattered. Bitcoin traded around $64,000 on November 18. Glassnode said a daily close below $62,000 could put buyers from August at a loss and leave the June low near $58,500 as the next level to watch. It also identified bitcoin’s realized price—the average price at which circulating coins last moved onchain—at $53,700. Glassnode noted a concentration of Binance buy orders near $60,000, but warned that traders could withdraw those orders.
Bitwise chief investment officer Matt Hougan offered a separate explanation for the selloff. He attributed it to a sharp change in expectations for Federal Reserve rates after an inflation report, with thin weekend trading amplifying the fall as roughly $2 billion in leveraged positions were liquidated.
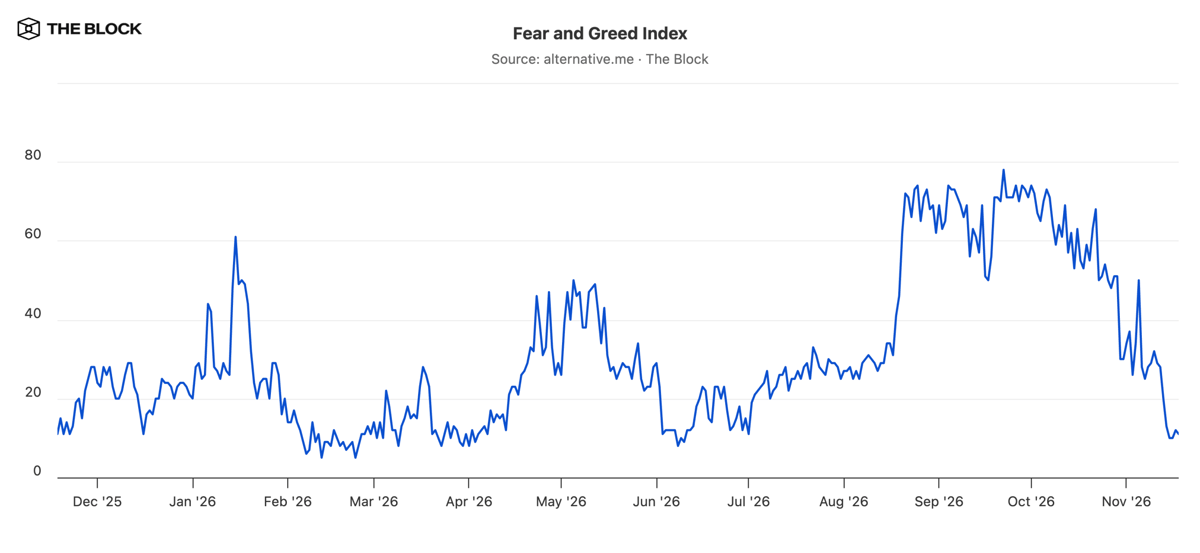
These measures describe stress in the market, not a reliable bottom signal. K33’s comparison with earlier selloffs leaves room for a drawn-out recovery, while Glassnode’s price levels describe what could happen if selling continues.